Polyv Private Domain Live Streaming Platform Data Statistics Capabilities Introduction
Polyv provides comprehensive data analysis, data dashboards, and data review systems, including full-spectrum pre-, during-, and post-live streaming data such as watch time, interaction, peak concurrent viewers, product conversion, and chat content. It not only presents the live streaming sales funnel effect but also prepares for subsequent user operations management.
1. Live Streaming Data Dashboard
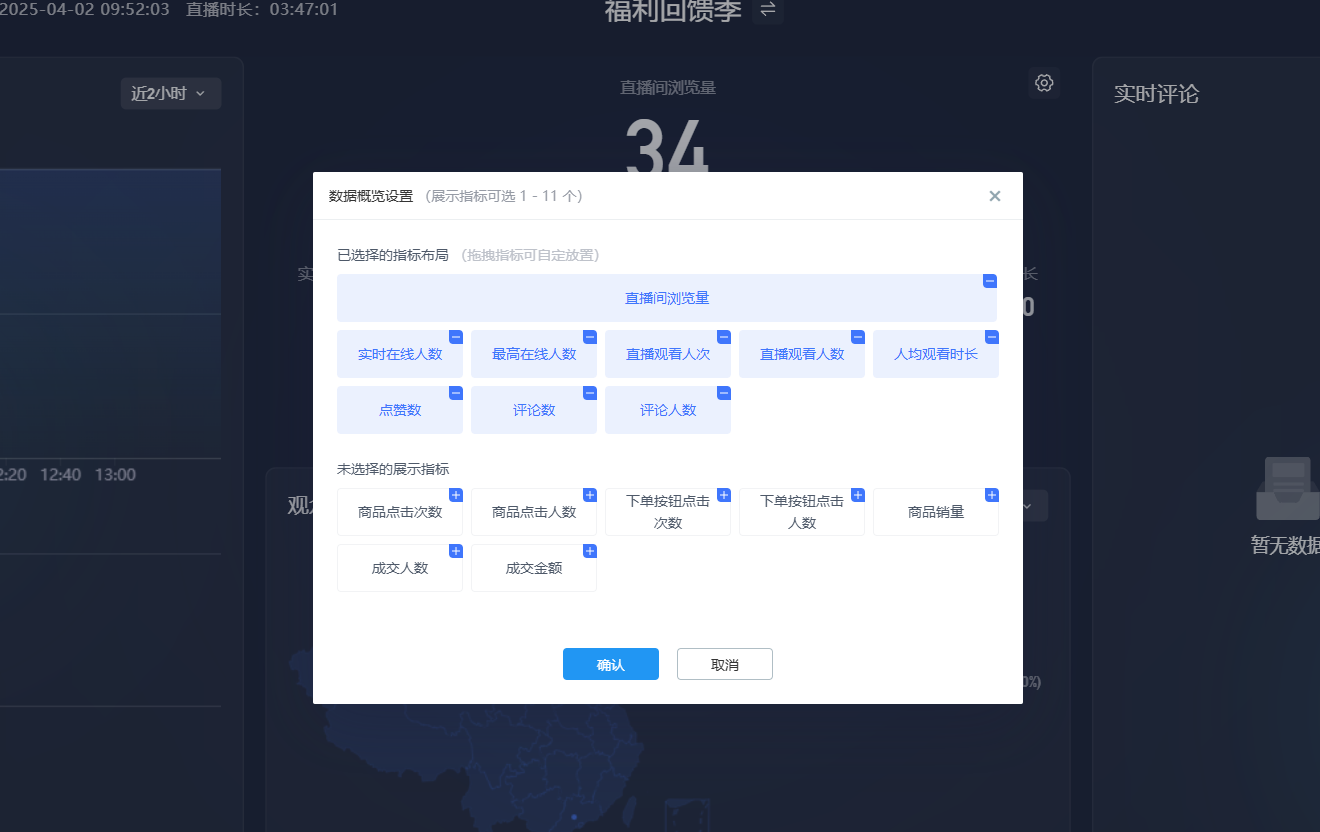
The Polyv backend data dashboard updates real-time data on live interactions, product clicks, invitation counts, user comments, and other metrics. By reviewing live room data, it helps brand merchants uncover users' genuine needs and improve live streaming operations.
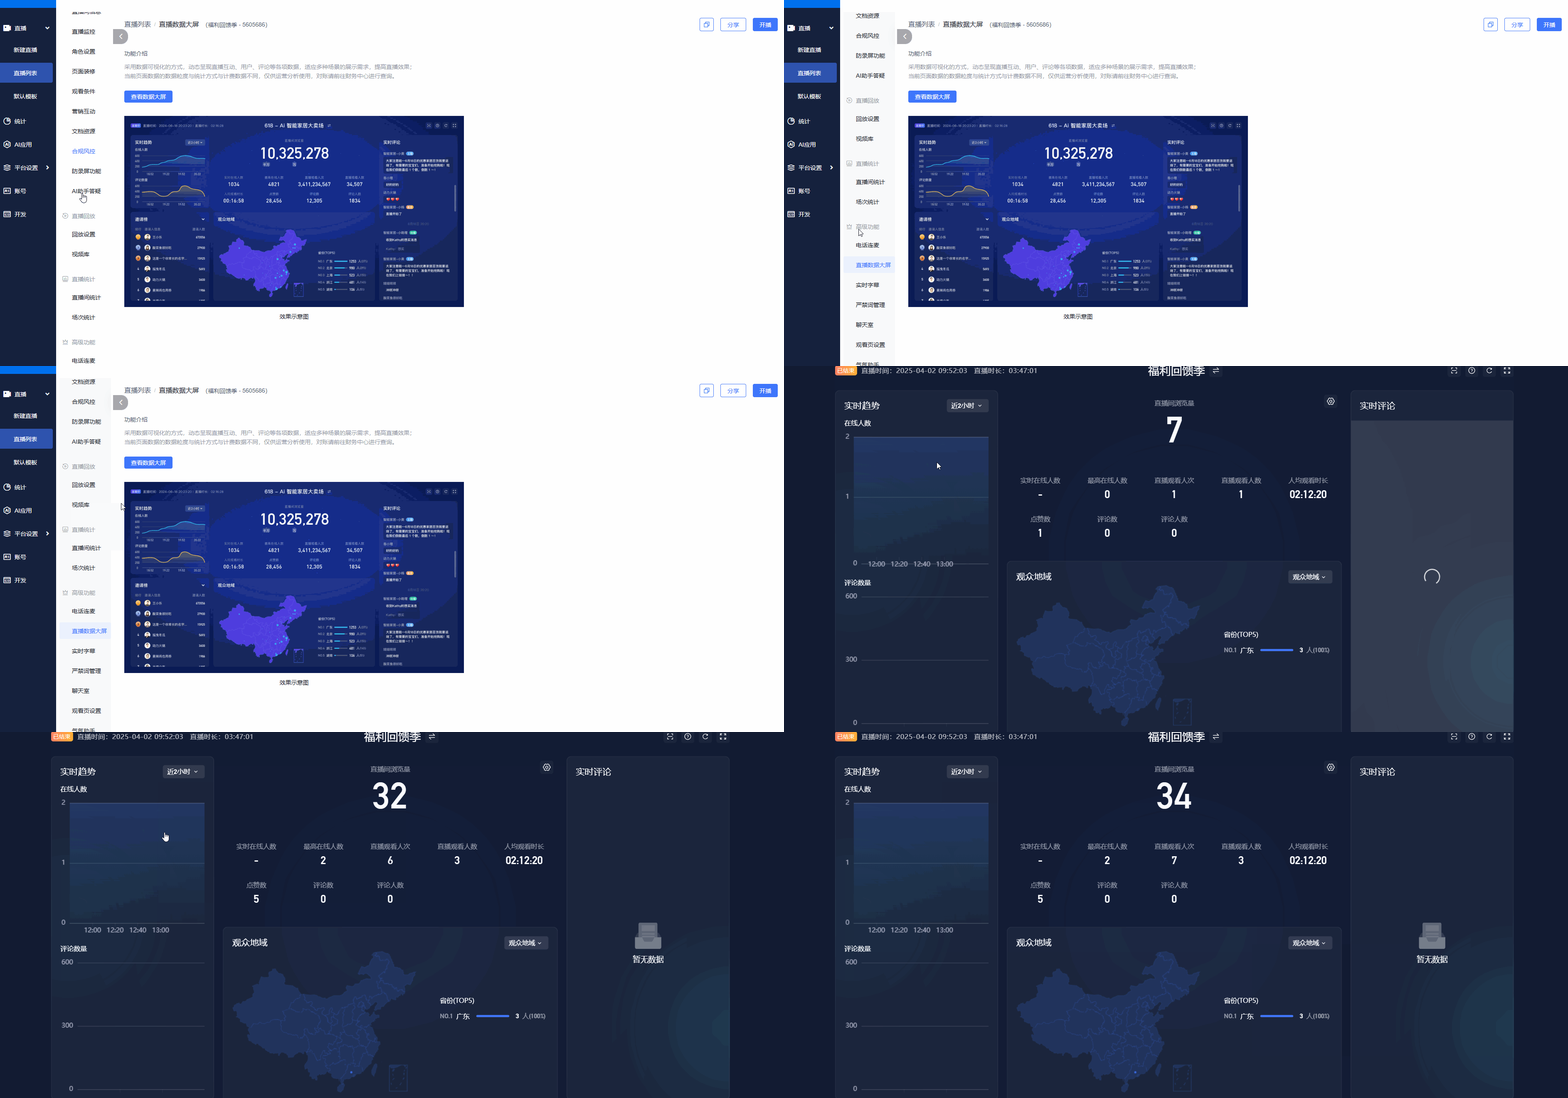
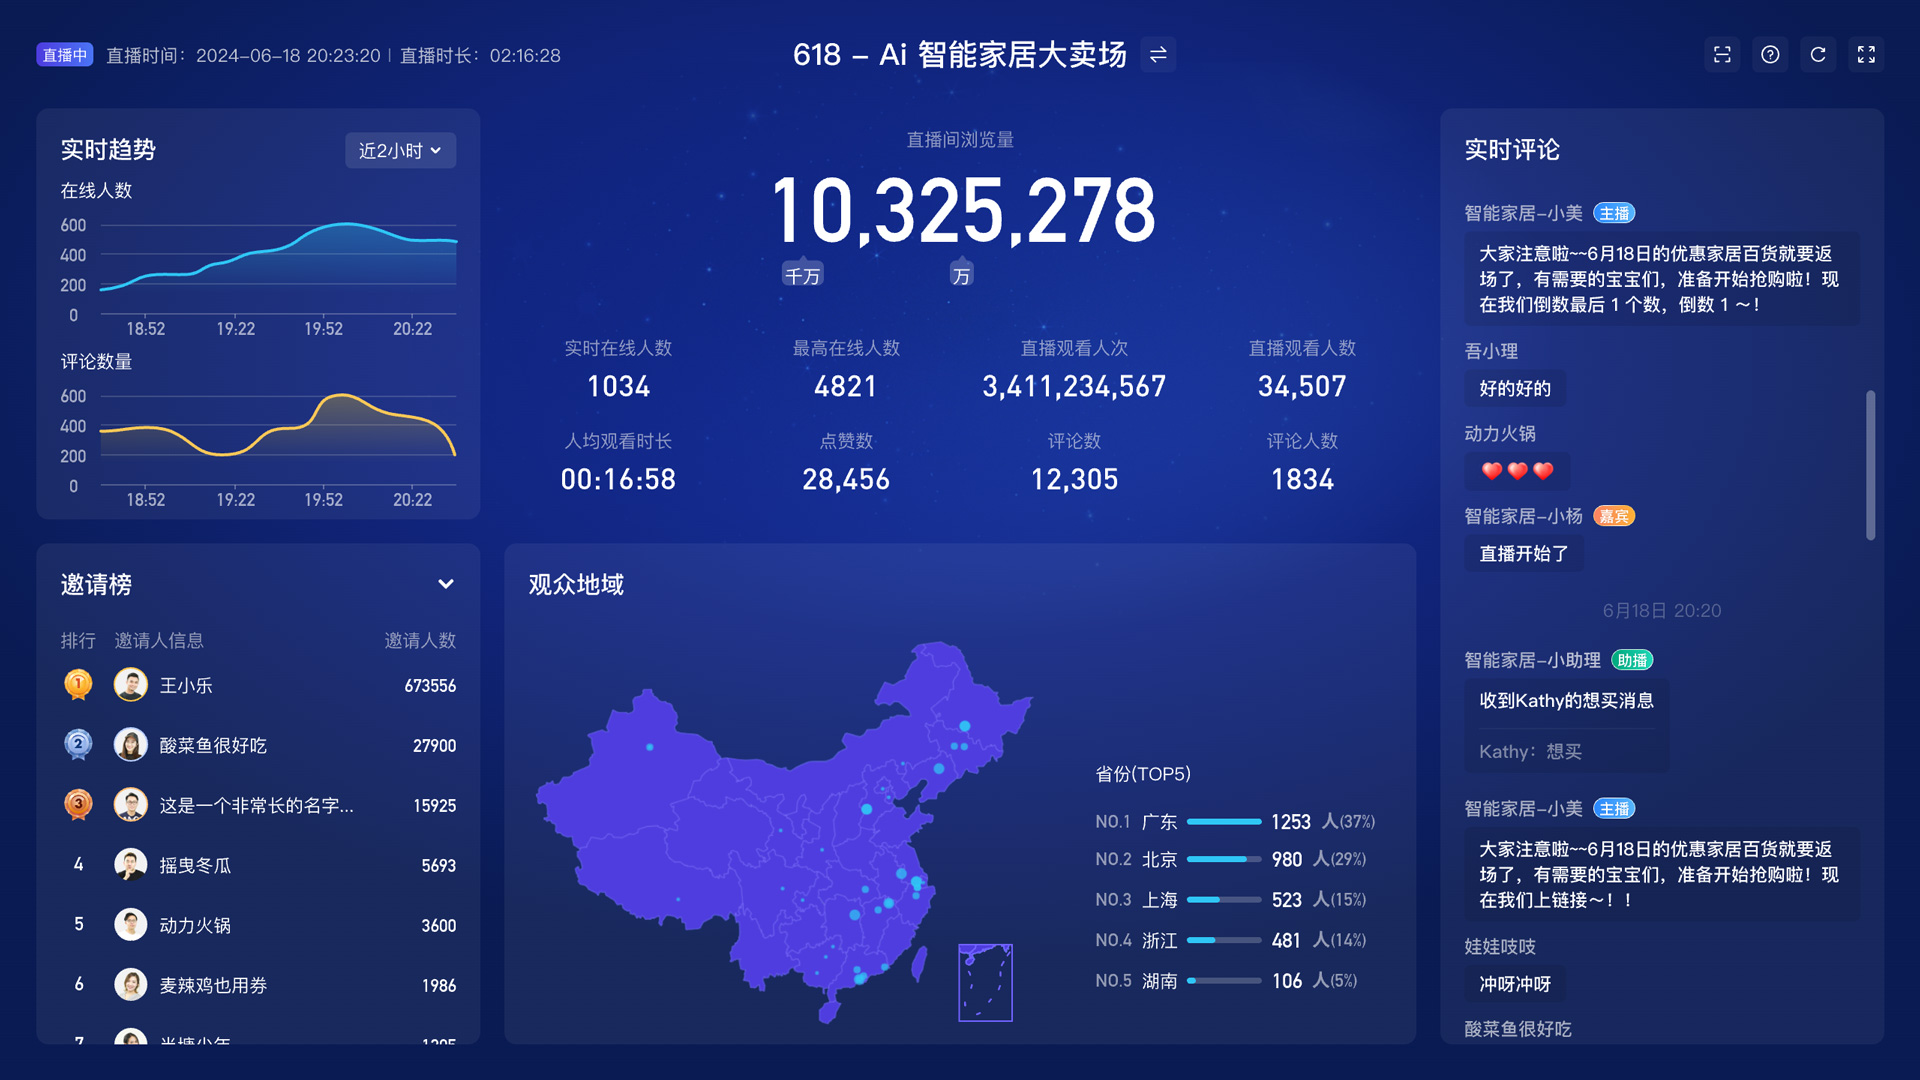
The live streaming data dashboard allows you to adjust the display layout of indicators according to your needs:
2. Live Room Statistics
(1) Data Statistics
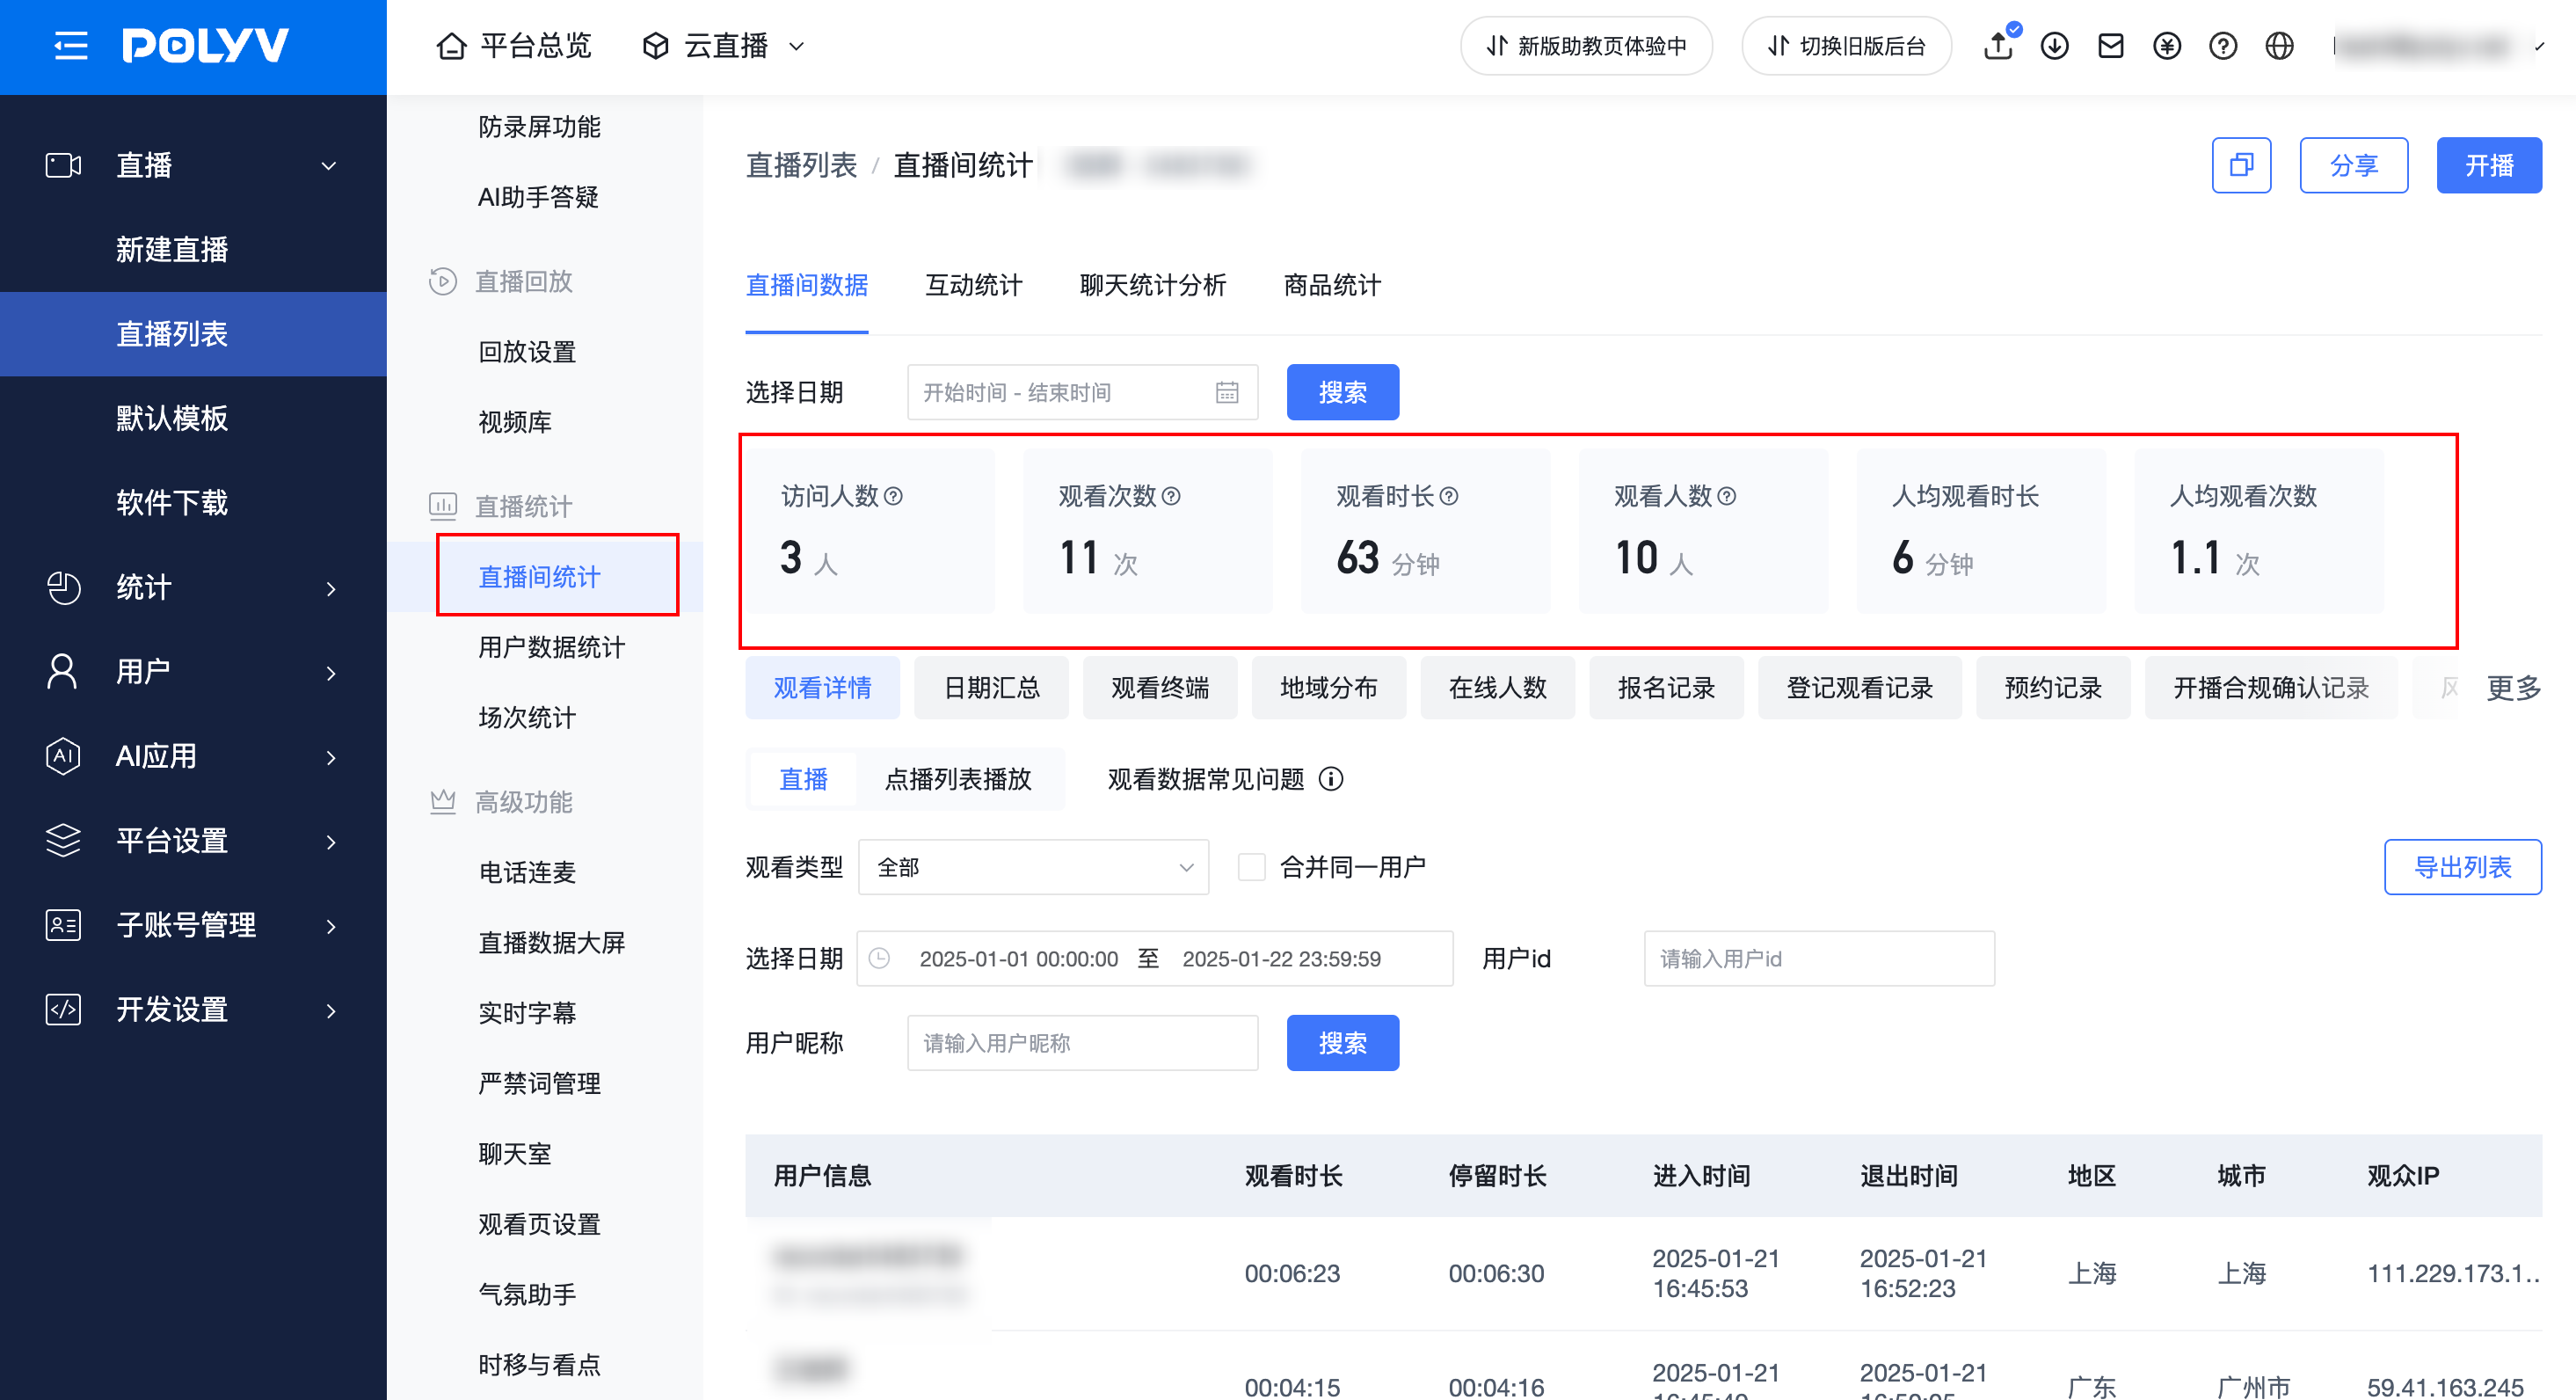
Data statistics mainly track the live streaming data of all channels on different dates. The statistics include visit count, watch time, number of viewers, average watch time per person, and average visits per person. Below are explanations of some indicators in the live room's "Data Overview," "Watch Details," and "Date Summary."
① Data Overview
Data Indicator |
Description |
|---|---|
| Visitors | 1. Total number of unique viewers who visited the live streaming viewing page 2. Same viewer visiting multiple times on the same day is deduplicated, counted as 1 3. If the same viewer visits on different days, it is counted per day. For example: Viewer A visits 2 times on the 15th, visitors count = 1; Viewer A visits once on the 15th and once on the 16th, visitors count = 2 |
| View Count | 1. Total number of actual live streaming views 2. Each player refresh counts as one view. For example: Viewer A watches the live stream and refreshes the player 2 times, view count = 2 |
| Watch Time | 1. Total duration of actual playback and viewing (excluding buffering or pause time) 2. Each watch record is rounded up, less than 1 minute is counted as 1 minute. For example: Viewer A watches for 1 minute 36 seconds, counted as 2 minutes |
| Viewers | 1. Number of deduplicated viewers who actually watched the live stream, deduplicated by IP address or User ID; 2. Deduplicated by day based on the selected date range. For example: Viewer A watches on both the 15th and 16th, viewers count = 2 3. Viewer A watches on both PC and mobile on the same day, viewers count = 2 |
| Average Watch Time | Formula: (Watch Time / Viewers), rounded to 1 decimal place |
| Average Views per Person | Formula: (View Count / Viewers), rounded to 1 decimal place |
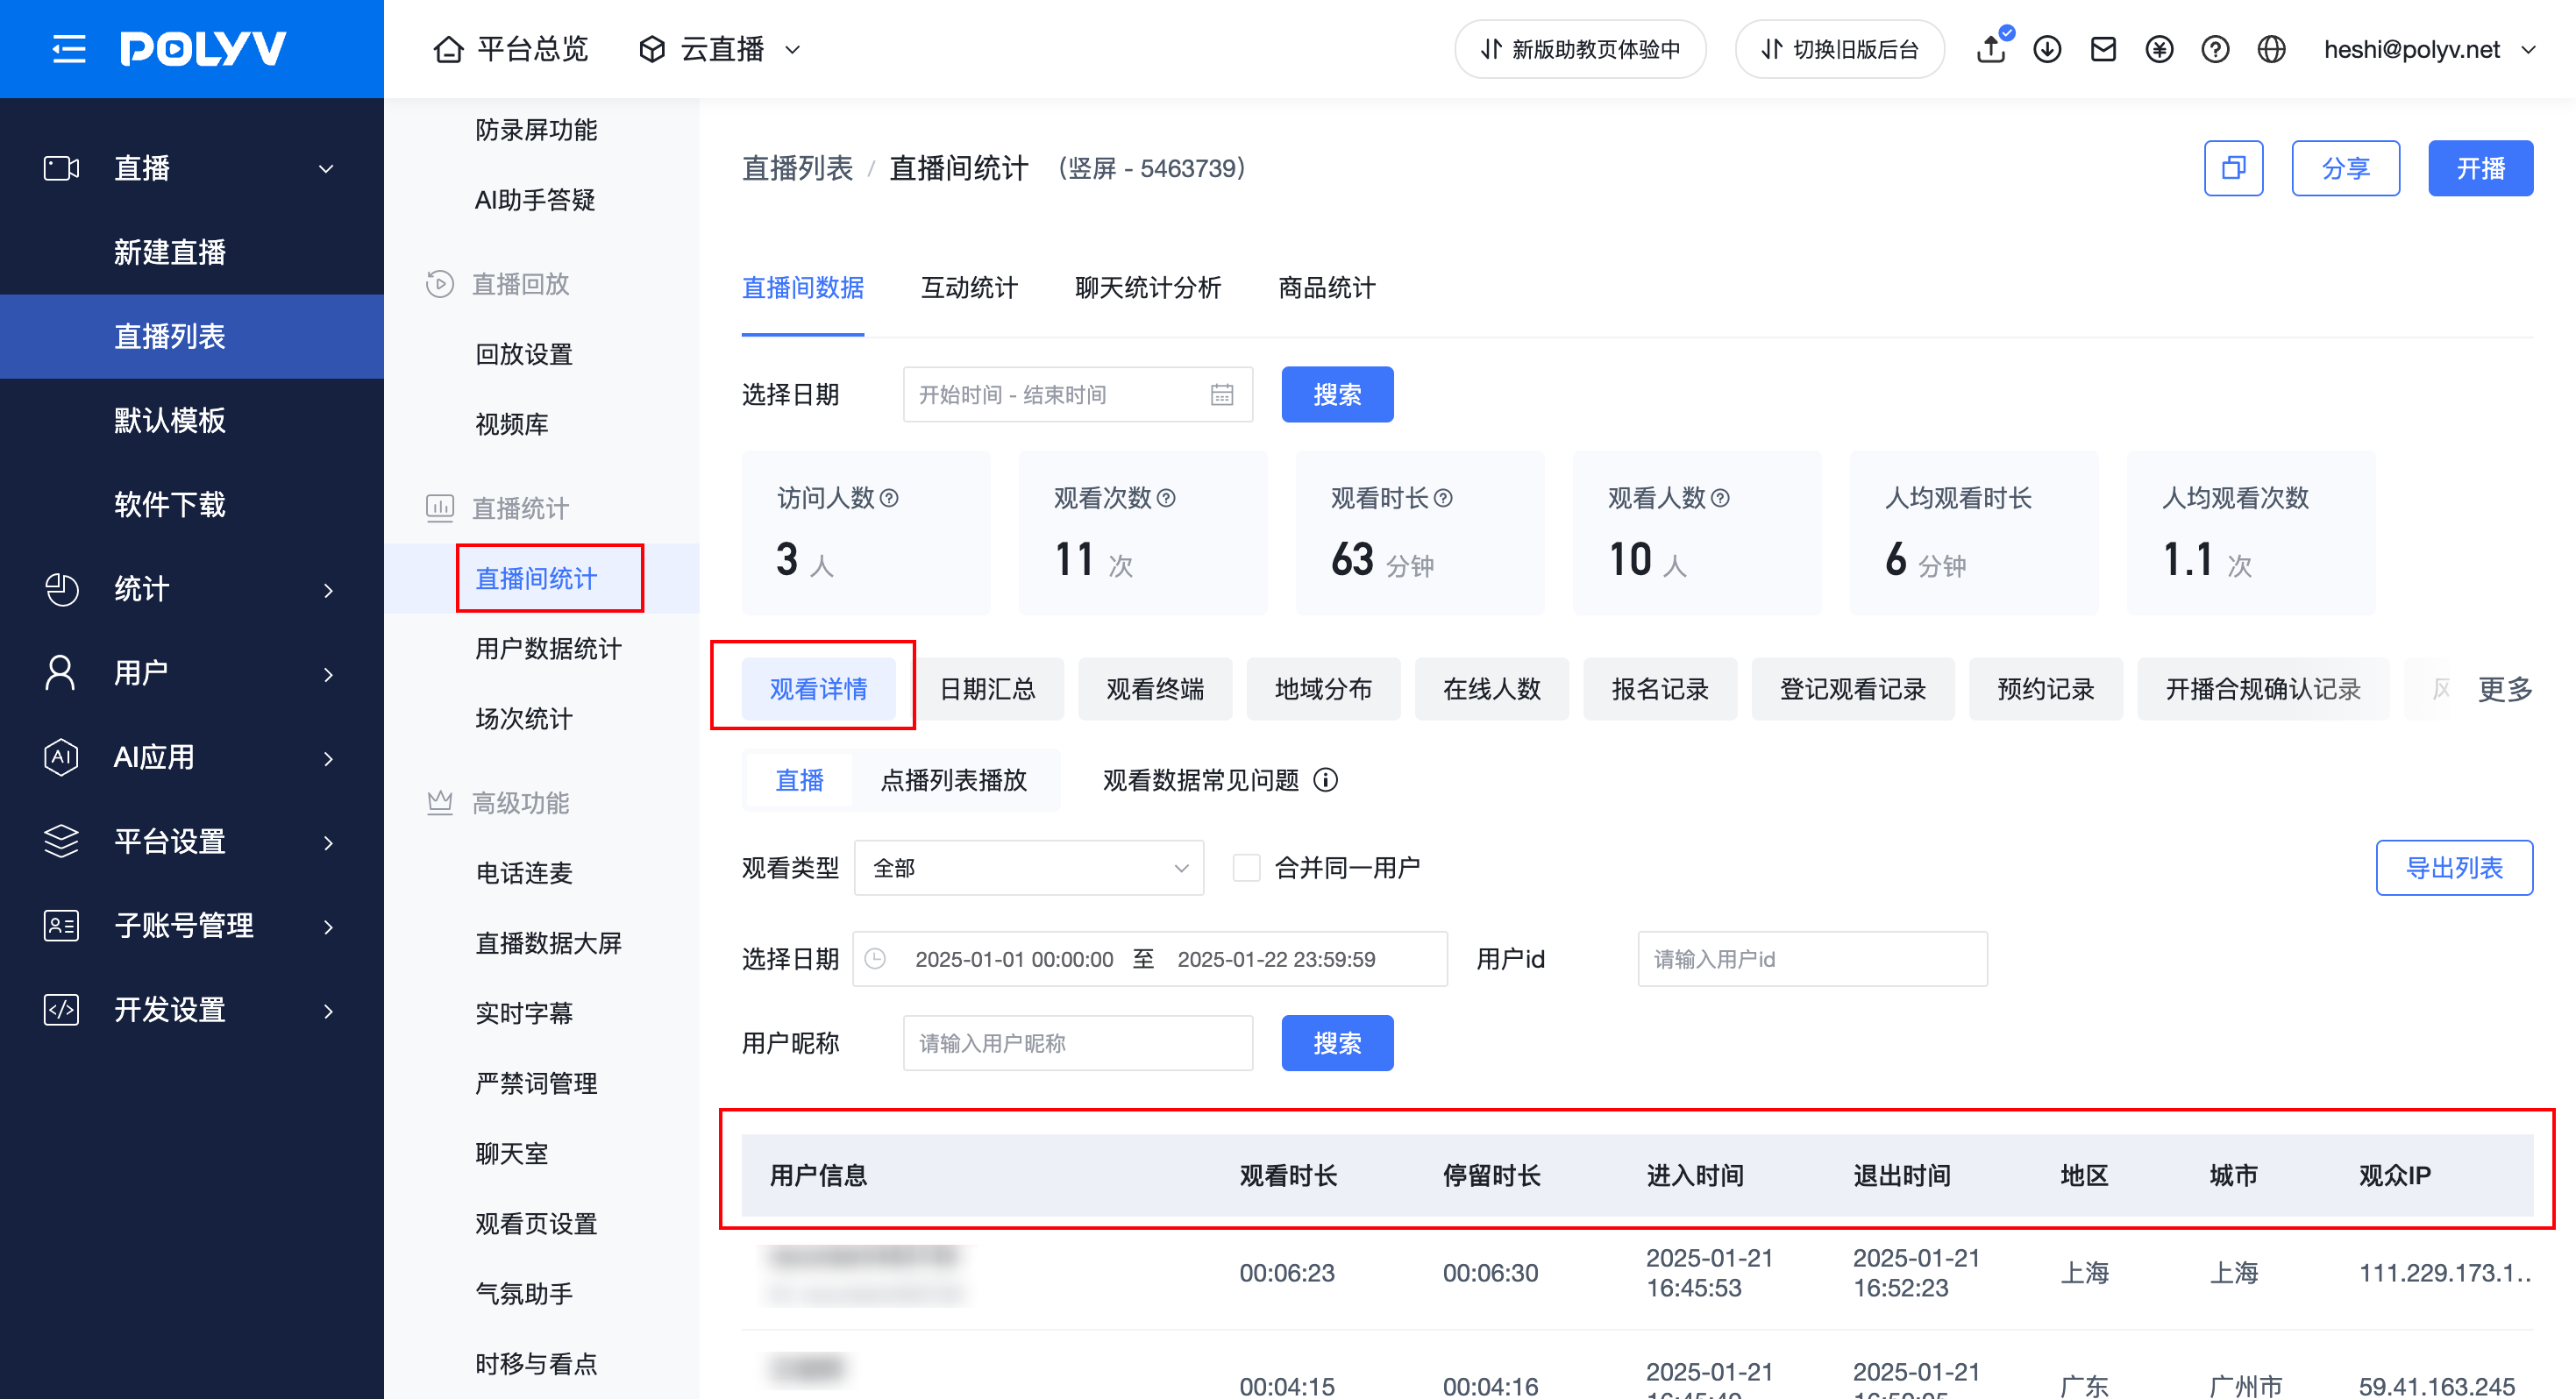
② Watch Details
Data Indicator |
Description |
|---|---|
| Watch Time | 1. Duration of actual playback and viewing (excluding buffering or pause time) 2.Each watch record is rounded up, less than 1 minute is counted as 1 minute. For example: Viewer A watches for 1 minute 36 seconds, counted as 2 minutes |
| Dwell Time | 1. Duration the viewer stays on the viewing page (including buffering or pause time) 2.Each dwell record is rounded up, less than 1 minute is counted as 1 minute. For example: Viewer A stays for 1 minute 36 seconds, counted as 2 minutes |
| Entry Time | The time when the viewer first watches the live stream after it starts |
| Exit Time | The time when the viewer exits the viewing |
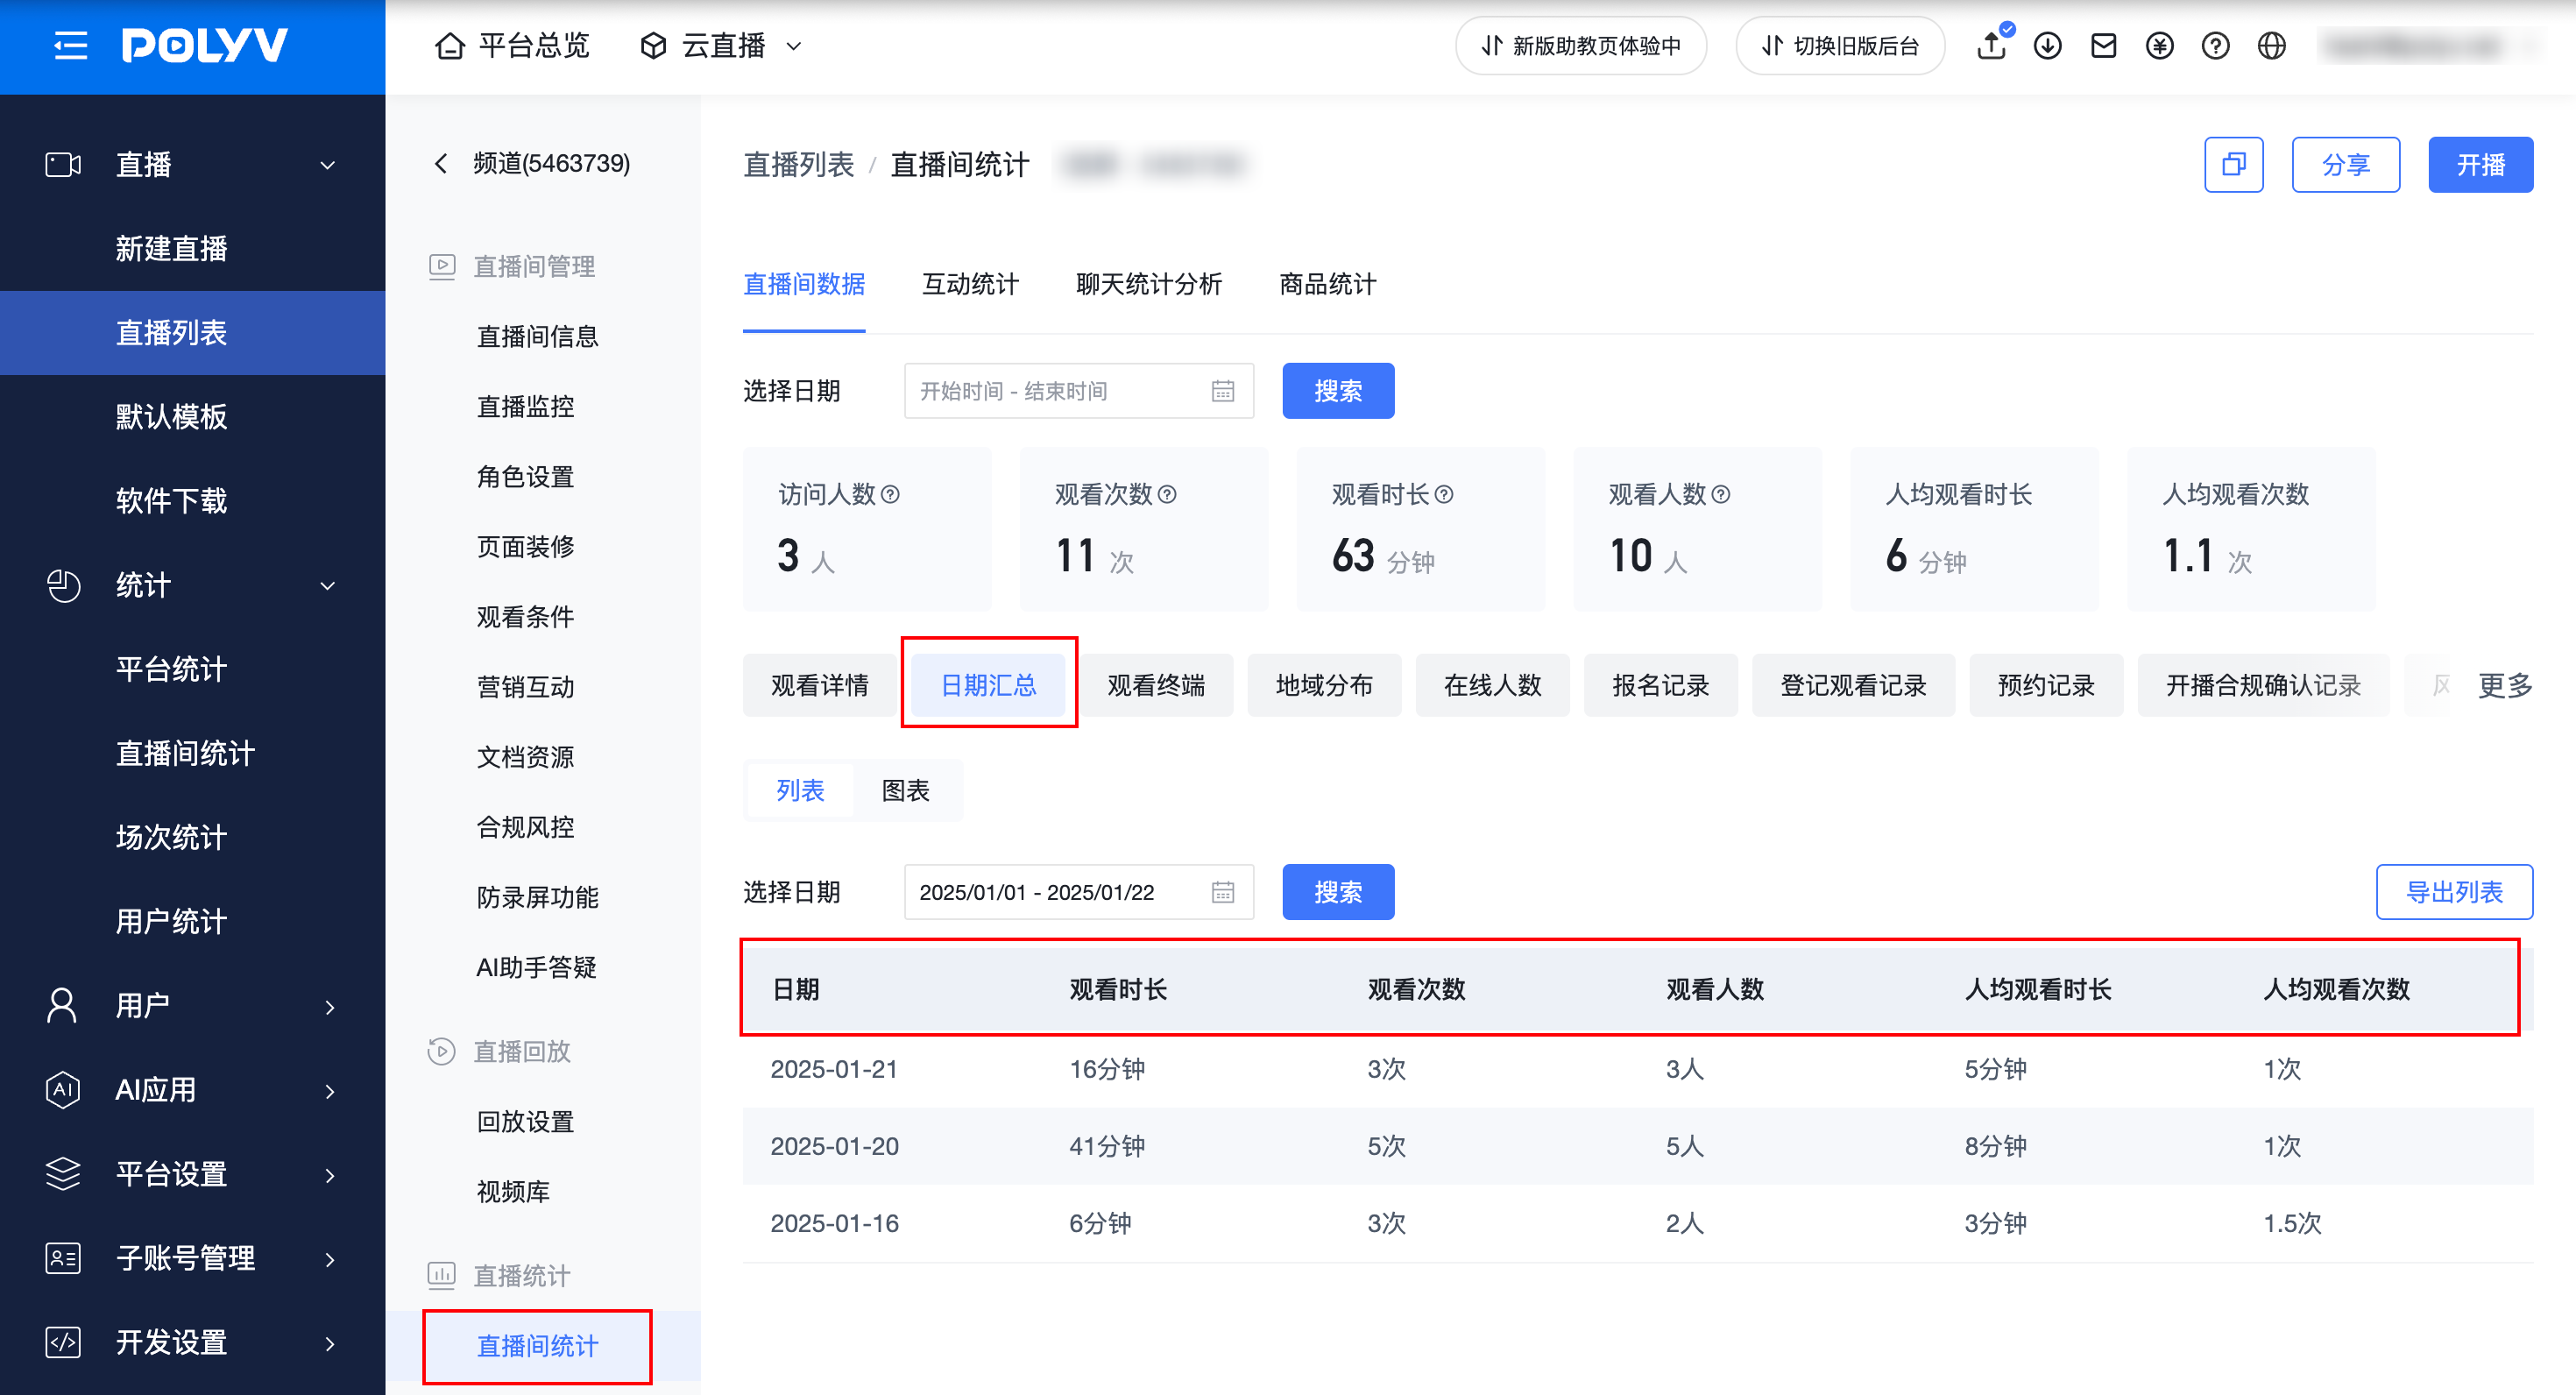
③ Date Summary
Data Indicator |
Description |
|---|---|
| Watch Time | 1. Duration of actual playback and viewing (excluding buffering or pause time) 2.Each watch record is rounded up, less than 1 minute is counted as 1 minute. For example: Viewer A watches for 1 minute 36 seconds, counted as 2 minutes |
| View Count | 1. Total number of actual live streaming views 2. Each player refresh counts as one view. For example: Viewer A watches the live stream and refreshes the player 2 times, view count = 2 |
| Viewers | 1. Number of deduplicated viewers who actually watched the live stream, deduplicated by IP address or User ID; 2. Deduplicated by day based on the selected date range. For example: Viewer A watches on both the 15th and 16th, viewers count = 2 3. Viewer A watches on both PC and mobile on the same day, viewers count = 2 |
| Average Watch Time | Formula: (Watch Time / Viewers), rounded to 1 decimal place |
| Average Views per Person | Formula: (View Count / Viewers), rounded to 1 decimal place |
(2) Session Statistics
When the same live room conducts multiple independent live streams by time segments, themes, or target audiences, administrators can view and distinguish the specific information of each session. This enables comparison of effects across different sessions, problem identification, host performance evaluation, user behavior tracking, and resource optimization.
Usage Instructions
① Session List
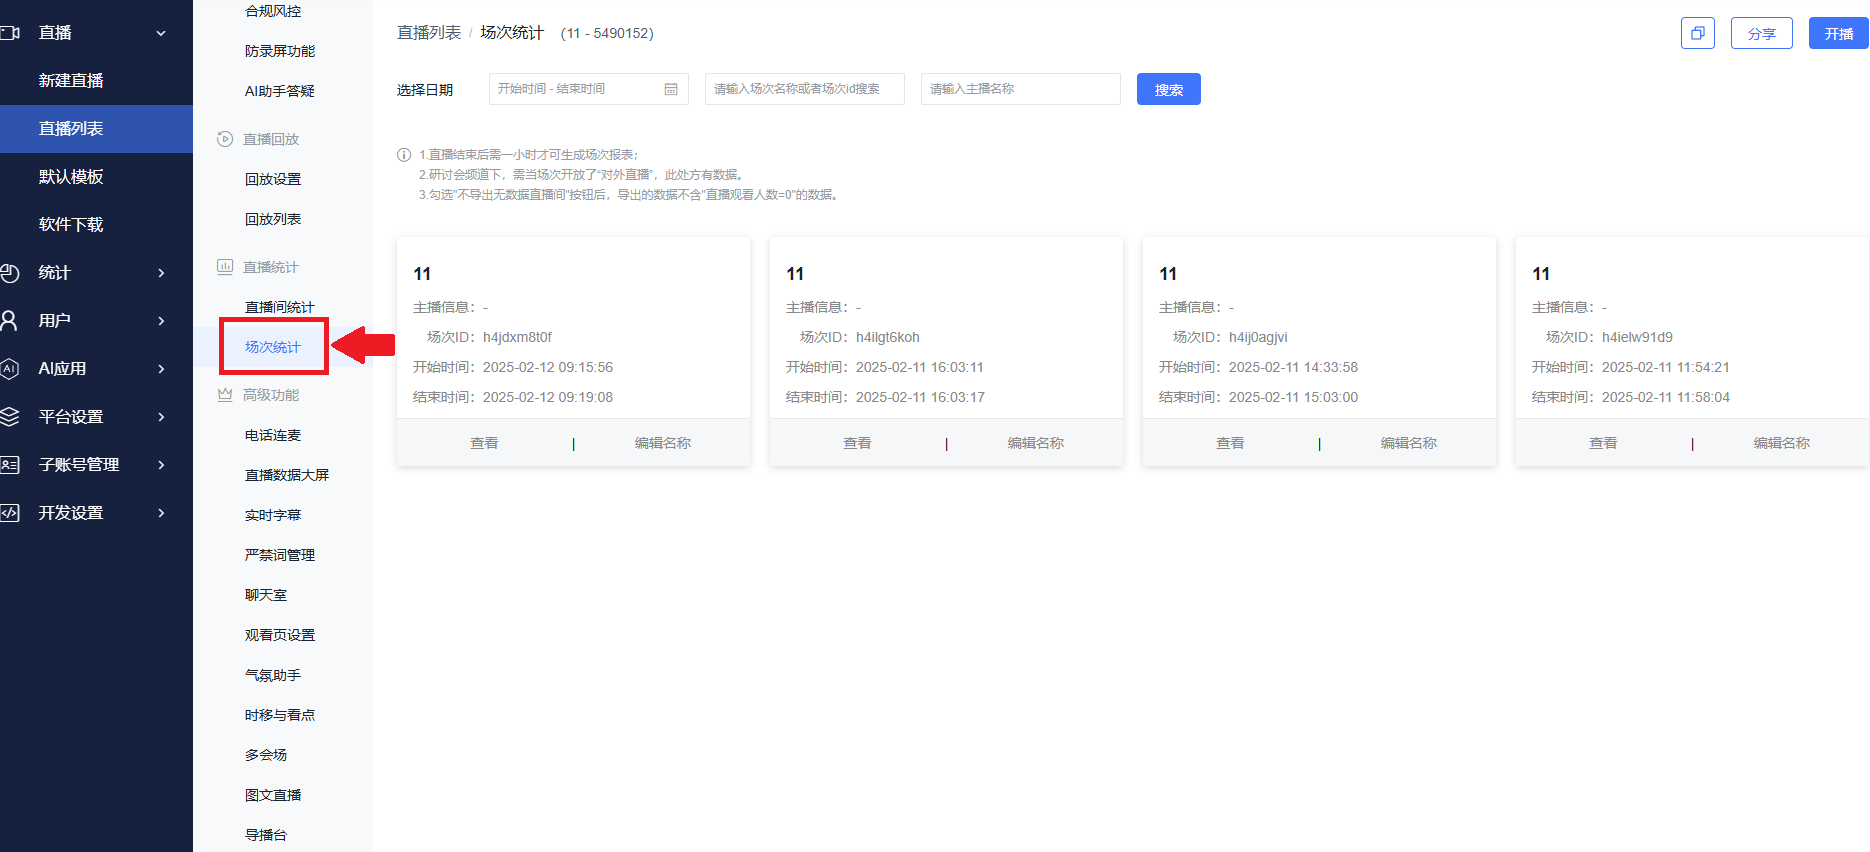
a. The administrator enters the live room backend and finds "Session Statistics" under the "Live Statistics" section.
b. You can filter a specific live stream by entering the start and end dates, session name or session ID, or host name.
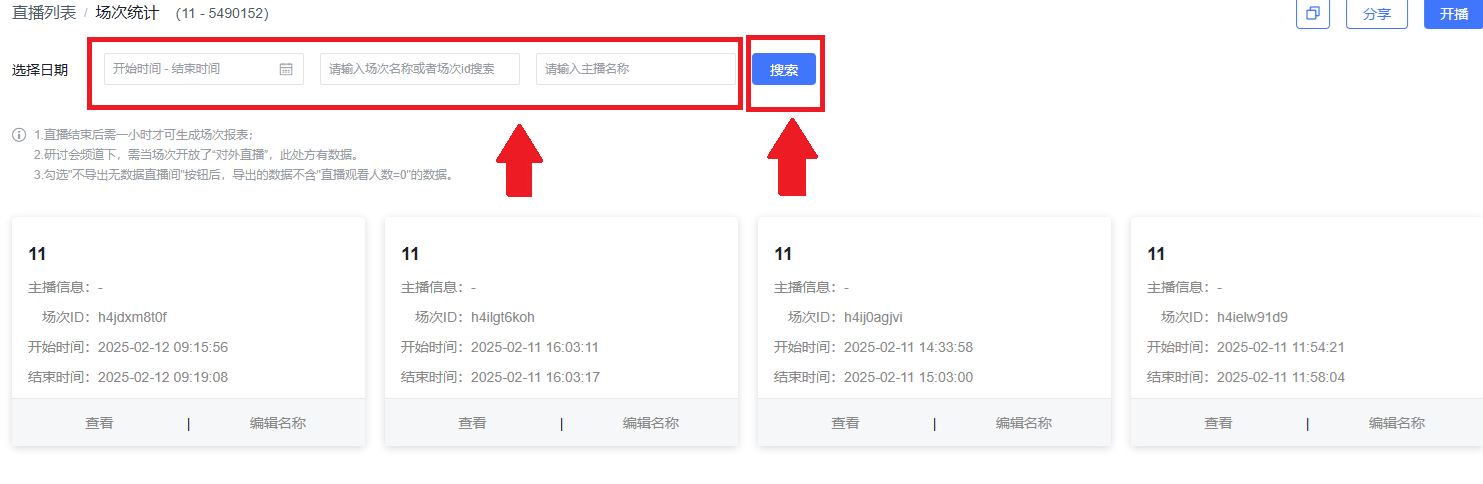
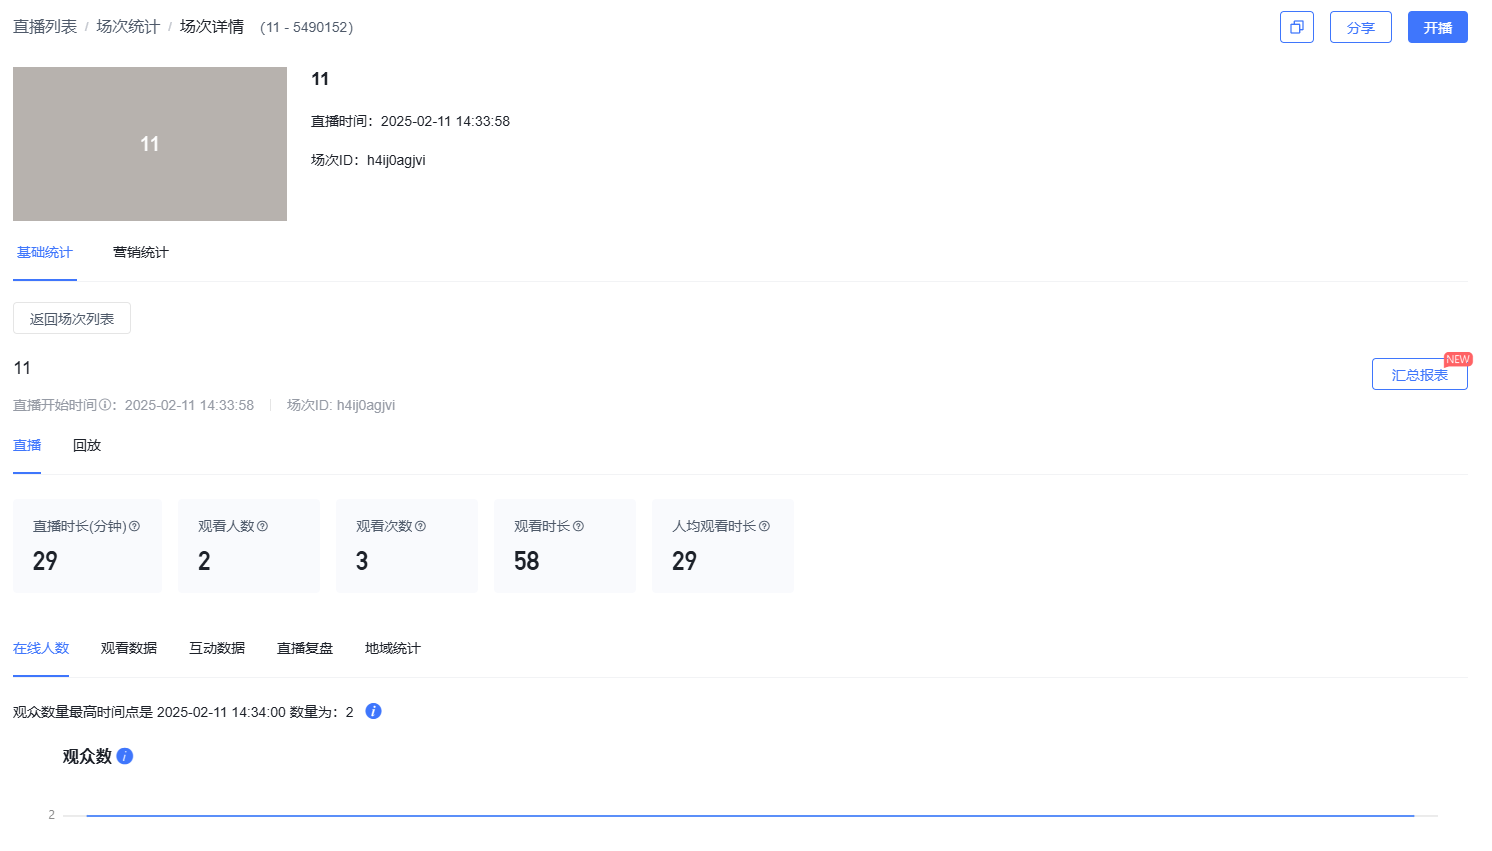
c. View detailed information of a specific live stream: Click the "View" button to enter the session details page.

② Live Session Details
a. On the live session details page, you can view basic session information, basic statistics, online viewers, watch data, interaction data, live review, and regional statistics. Click "Summary Report" to aggregate all live room data and choose to download.
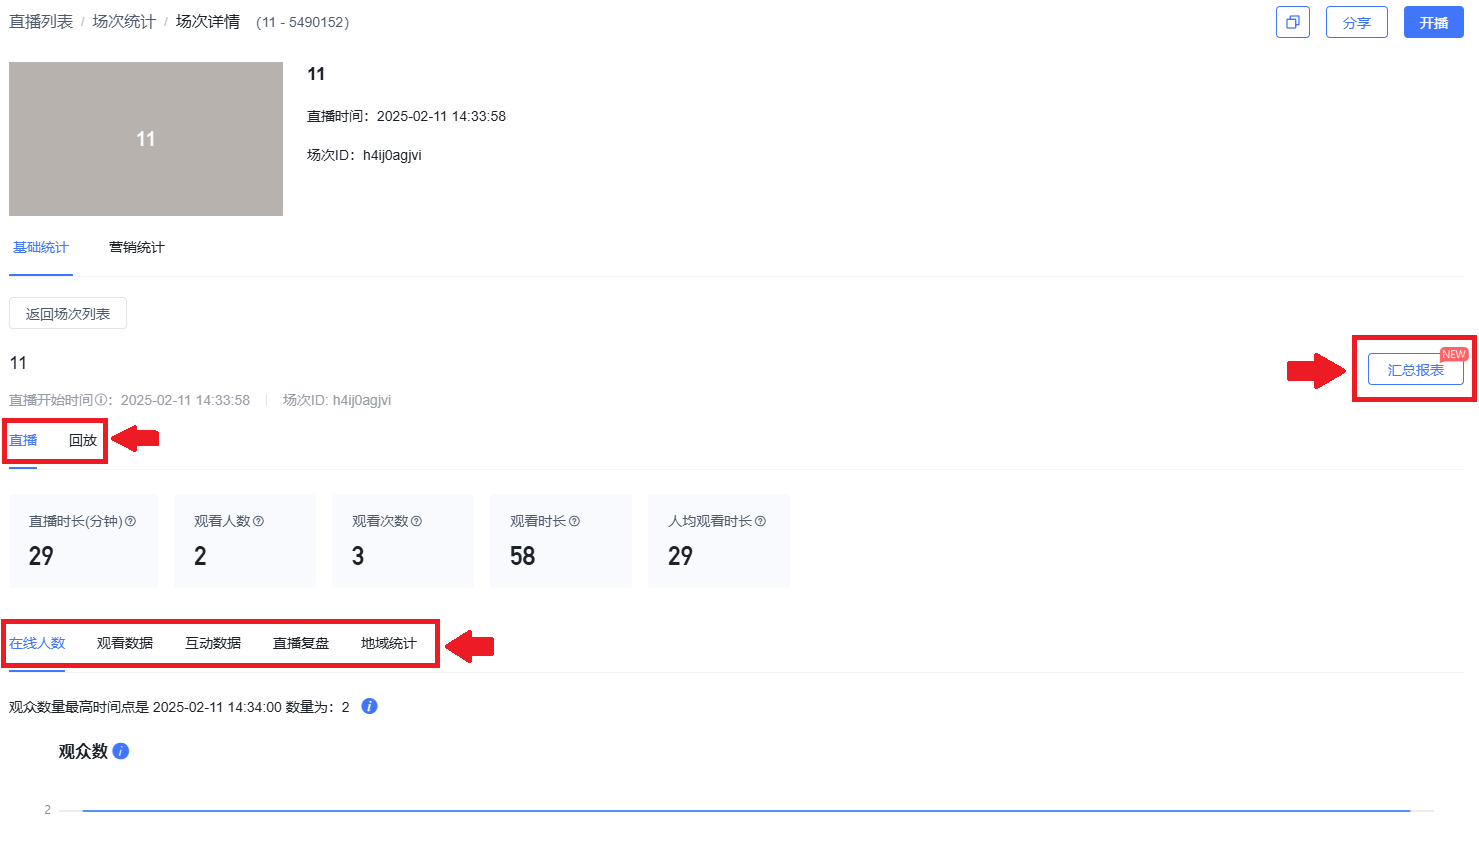
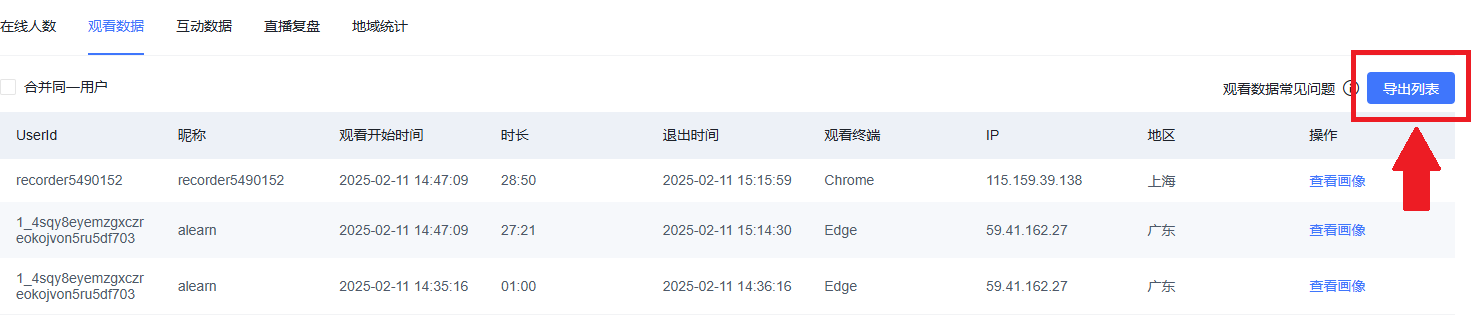
b. Export live session-related data. As shown in the figure, you can choose to export the viewer user list, check-in count list, quiz card list, red envelope count list, prize winner list, chat list, Q&A list, quick answer list, etc.

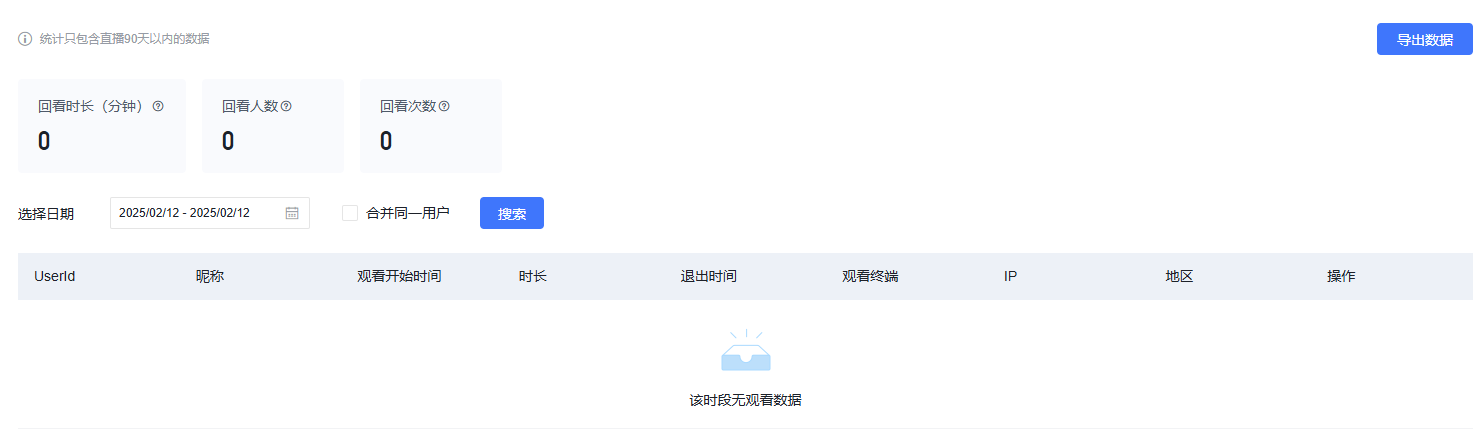
c. "Replay Statistics": You can view the live replay statistics for that session within 90 days, view details of users who watched the replay, and export data.
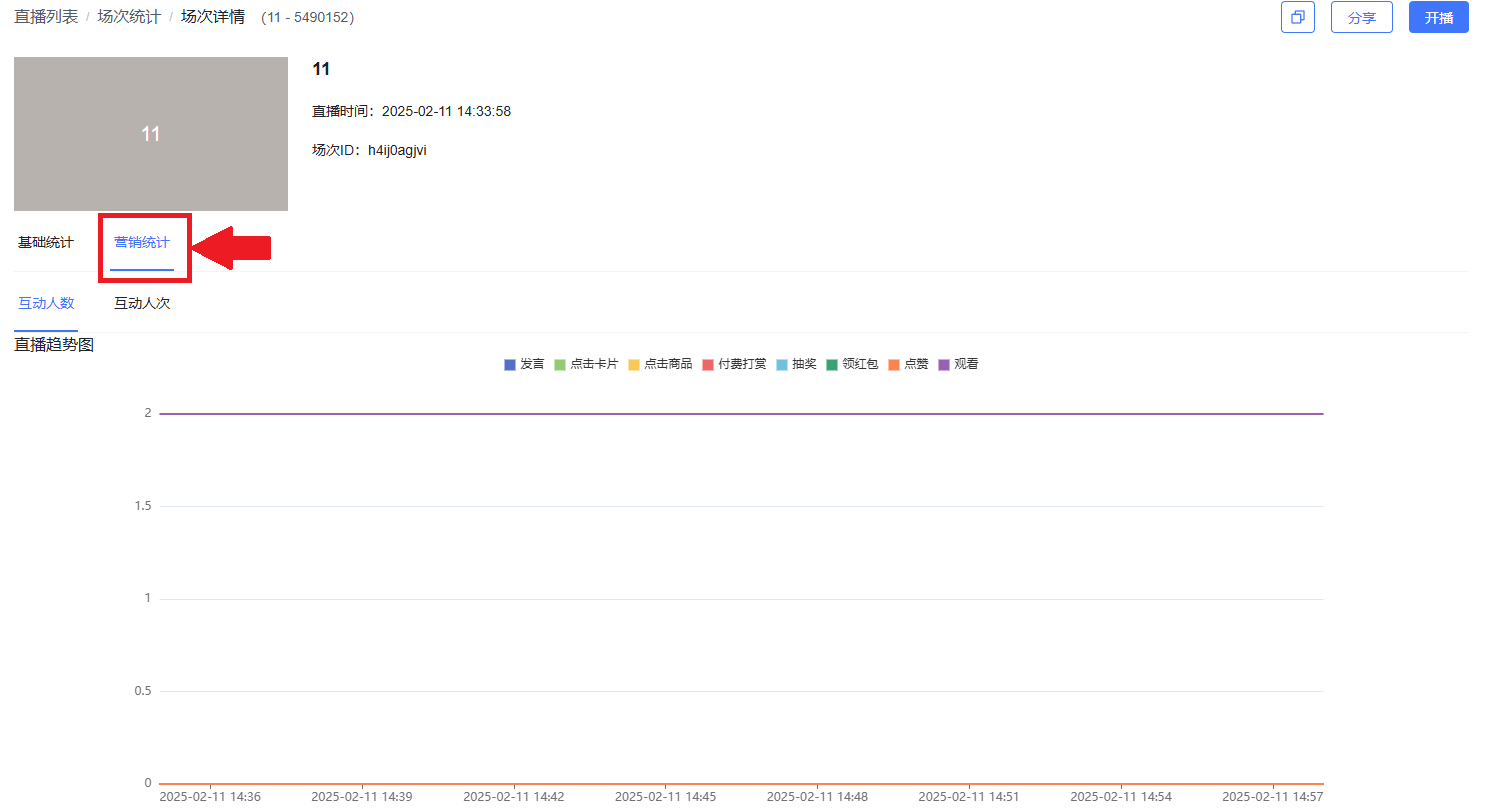
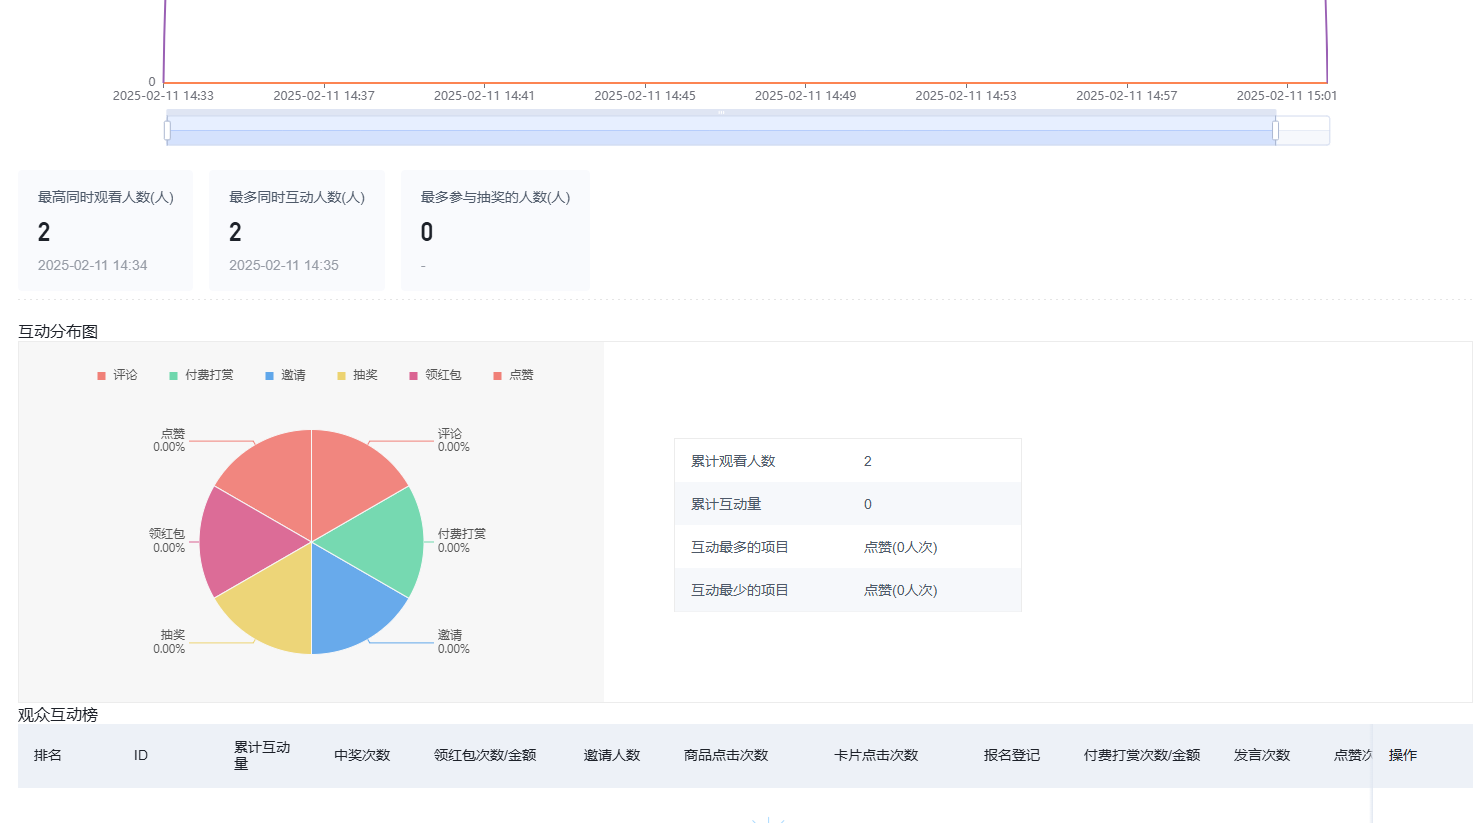
d. "Marketing Statistics": Click on marketing statistics to view marketing-related data and charts, including card clicks, product clicks, paid tips, lucky draws, likes, red envelope collection, likes, and other features.