Account Dimension
Updated: 2021-05-21 15:08:10
The statistics cover space/traffic, traffic usage, and space usage.
Space/Traffic
You can view the overall usage of space and monthly traffic. The data is presented in a pie chart, as shown below:

Traffic Usage
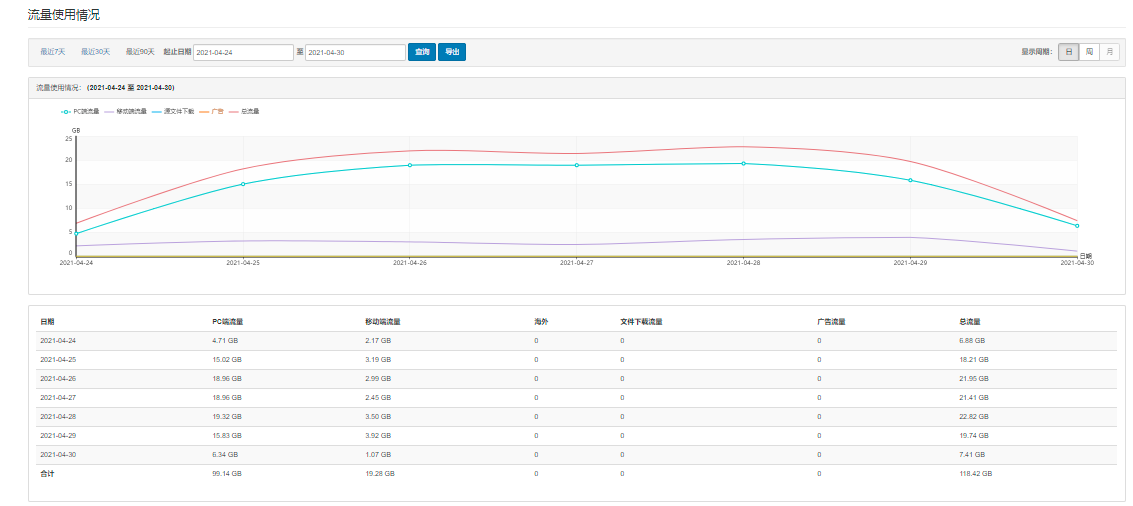
The statistics include PC traffic, mobile traffic, source file downloads, ads, and total traffic. The data is presented in a line chart and a data table. You can select the desired time period (custom, last 7 days, last 30 days, last 90 days) and customize the display cycle (day, week, month), as shown below:
Space Usage
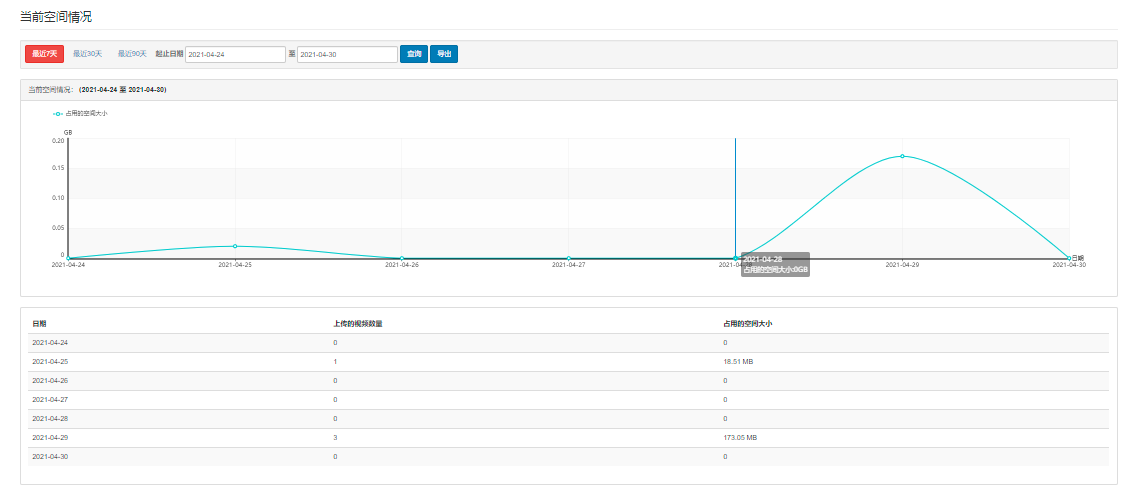
The statistics include occupied space size and the number of uploaded videos. The data is presented in a line chart and a data table. You can select the desired time period (custom, last 7 days, last 30 days, last 90 days), as shown below: