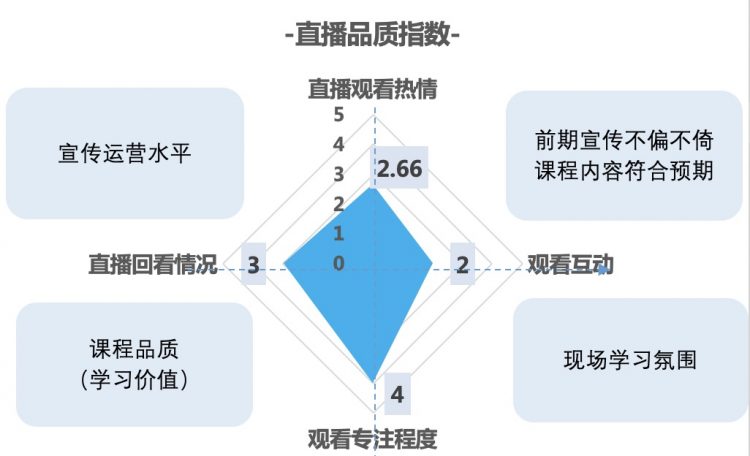
Introduction to Live Streaming Quality Index
Background
An effective live stream requires thorough preparation across all stages, including pre-stream preparation, promotion, live execution, interaction, and post-stream analysis and review.
Polyv has been striving to assist customers throughout the entire live streaming chain. The Live Streaming Quality Analysis feature focuses on providing data metrics from the perspective of enterprise live stream operators to measure the quality of live stream operations.
Live streaming quality analysis is built on a big data infrastructure. By collecting all data related to a live stream (including viewing data, chat room data, and interaction data), it calculates metrics such as audience punctuality rate, viewing duration, exit rate, interaction rate, and replay viewing rate. These are then comprehensively analyzed to derive scores for four key operational indicators: Viewing Enthusiasm, Engagement Level, Interaction Enthusiasm, and Replay Viewing. This effectively and intuitively helps enterprises evaluate their live stream promotion and operational level, course content, learning value, and on-site learning atmosphere.
Feature Overview
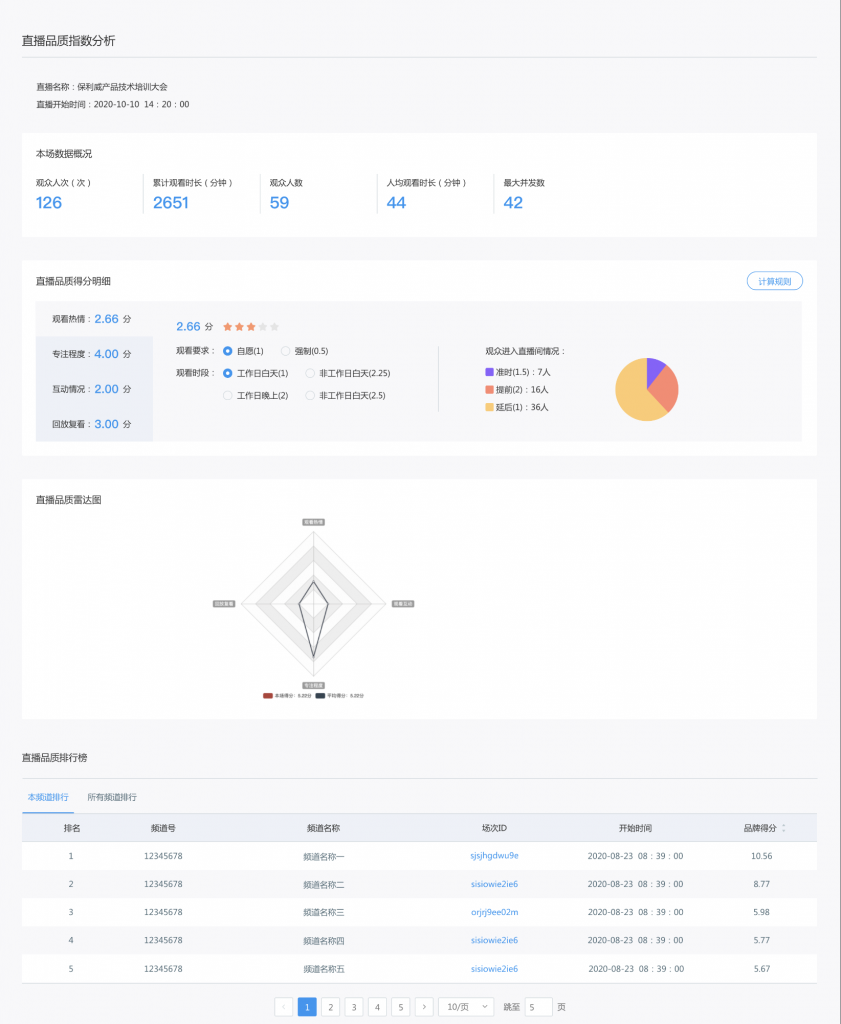
The Live Streaming Quality Index analysis page includes four sections: Overview of Current Stream Data, Quality Score Details, Quality Radar Chart, and Quality Ranking, as shown below:
I. Quality Score Rules
1. Viewing Enthusiasm
The calculation dimensions for the Viewing Enthusiasm score include:
- Viewing Requirement: Whether the live stream is voluntary or mandatory.
- Viewing Time: Whether the stream takes place on a workday, and whether it is during the day or evening.
- Audience Entry: The proportion of viewers who entered early, on time, or late.
The weight for each dimension is indicated in parentheses. The calculation rule for Viewing Enthusiasm is: (Number of early entries * weight + Number of on-time entries * weight + Number of late entries * weight) / Total viewers * Viewing requirement weight * Viewing time weight.
For example, if Company A holds a voluntary (weight 1) training live stream on a workday evening (weight 2), with 7 viewers entering on time (weight 1.5), 16 entering early (weight 2), and 36 entering late (weight 1), the Viewing Enthusiasm score would be: (71.5 + 162 + 36*1) / (7+16+36) * 1 * 2 = 2.66 points.
2. Engagement Level
The calculation dimensions for the Engagement Level score include:
- Average Exits per Viewer: Total exits / Total viewers. Score: 5 points for [1,2], 4 points for (2,3], 3 points for (3,4], 2 points for (4,5], 1 point for (5,5.5], 0 points for >5.5.
- Average Viewing Duration: Total viewing duration / Total viewers. Score: 0 points for (0,10%], 1 point for (10%,25%], 2 points for (25%,40%], 3 points for (40%,50%], 4 points for (50%,75%], 5 points for (75%,100%] of total stream duration.
- Remaining Viewers 5 Minutes After Stream Ends: Used to roughly estimate idle viewers. Score: 5 points for [0,10%], 4 points for (10%,20%], 3 points for (20%,30%], 2 points for (30%,40%], 0 points for >40% of viewers present at stream end.
The calculation rule for Engagement Level is: (Exit score + Viewing duration score + Anti-idle score) / 3.
3. Interaction Enthusiasm
The calculation rule for the Interaction Enthusiasm score is: The proportion of unique viewers who participated in likes, tips, check-ins, surveys, or chat room messages out of the total viewers in the live room. Score: 1 point for (0,10%], 2 points for (10%,25%], 3 points for (25%,35%], 4 points for (35%,50%], 5 points for (50%,100%].
4. Replay Viewing
The calculation rule for the Replay Viewing score is: The proportion of viewers who watched the live stream and then also watched the replay out of the total viewers. Score: 1 point for (0,5%], 2 points for (5%,10%], 3 points for (10%,15%], 4 points for (15%,20%], 5 points for >20%.
Note: The replay viewing rate only counts data within 14 days after the live stream ends. The number of replay viewers is updated daily during this period, so the score may change. After 14 days, statistics stop.
II. Live Streaming Quality Radar Chart
The quality radar chart is drawn based on the scores of the four indicators: Viewing Enthusiasm, Engagement Level, Interaction Enthusiasm, and Replay Viewing. The total score for the entire live stream is: (Viewing Enthusiasm score + Engagement Level score) * (Interaction Enthusiasm score + Replay Viewing score) / 2, which represents the area of the radar chart.
The larger the radar chart area, the higher the live stream quality score.